Ethereum (ETH) faces a major crash losing over 25%!

Ethereum’s real-life potential and scalability might be on the gaining end, but the value of ETH is driven by simple laws of supply and demand. As the mining process has already stopped on the Ethereum blockchain, buyers now expect a major decline in its value.
ETH has shown a wipeout of tremendous value from the November 4, 2022 peak. Ethereum’s drastic crash has come as a shock, but similar price trends are being witnessed across the crypto space. Could this be another decline in crypto prices before the bulls take control of the price action?
Ethereum maintains its 2nd spot, but tokens like FTX have lost over 70% in the last 24 hours with no hopes of improving situations anytime sooner. ETH will be heading towards new peak values only after finding better support and a strong bounce-back level to incite new buyers.
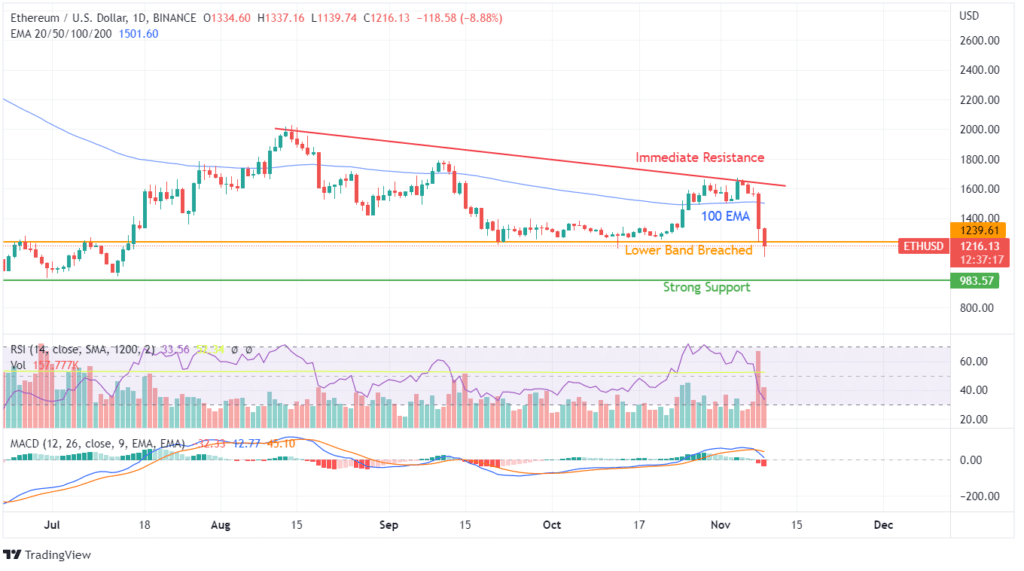
Ethereum price action has jumped from the low of $900 in September, and the gain to $1500 was a welcoming sign. But things turned sour as the momentum failed to consolidate and move towards new highs. Instead, ETH is witnessing a major crash which is now threatening to reach new lows below the previous nightmare of $885.

The declining resistance curve from August has now created a stronger rejection zone at $1600. Failure to hold prices above the 100 EMA curve allowed sellers to take control of the price action. This resulted in a major crash of prices as Ethereum witnessed a huge decline on November 8, followed by another decline today. Even the technical indicators of RSI and MACD show a strong negative trend.
RSI has already dropped from the high of 70 to the close of 25, indicating an oversold zone, which could last for months. The MACD indicator, on the other hand, has already created a bearish crossover trend. With volumetric transactions showing new highs and price action displaying extreme weakness, the outlook for Ethereum seems dark for the coming month.
The support level of $1200 has already been breached once, but candlesticks are showing buying from the lower end, as confirmed by the formation of wicks. Your resistance to the part of an uptrend would be 50 EMA and 100 EMA curves.
On weekly price action, the consolidation and uptrend established in the last two months have been decimated by a single weekly negative candle. Such price action would be the third repetition since hitting $2000 in August of 2022.
The negative trend line can be confirmed from the price action, but there is a hope of retracement from current levels. However, the repetition of such declining price action could not be ruled out.


